
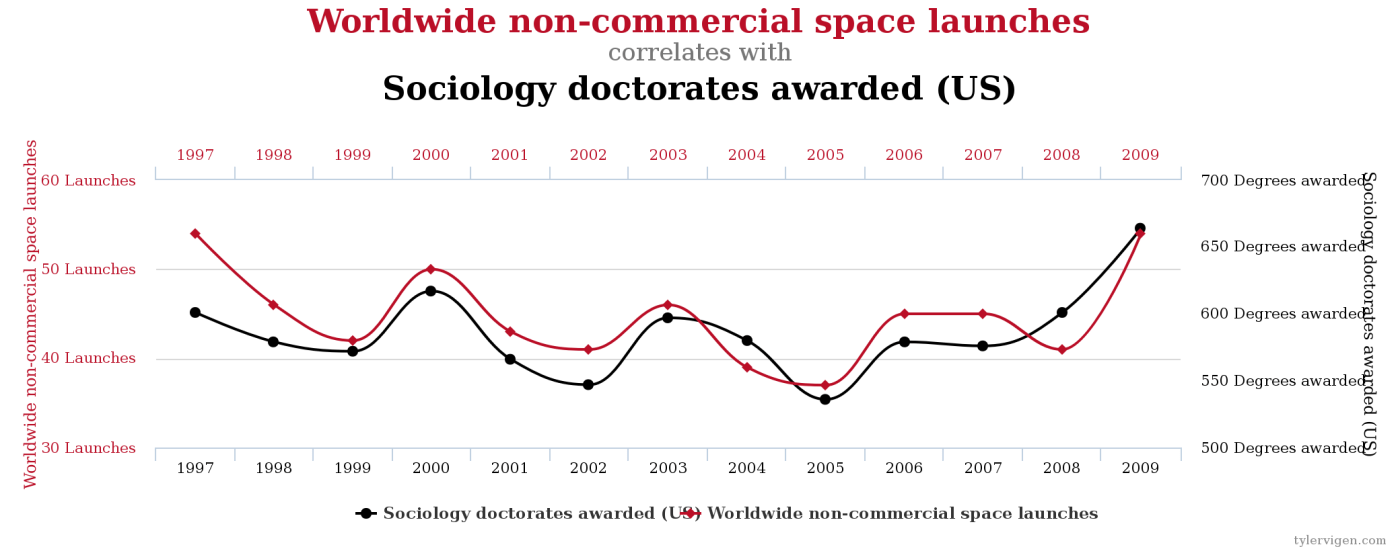
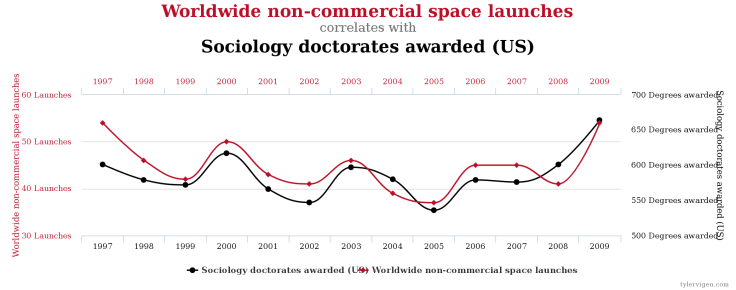
It seems so if your’re looking at the following graph !
But this is just another example of taking for causality what in reality is just a numeric correlation between to variables.
In theory, causality and correlation are easy to distinguish—an action or occurrence can cause another (such as smoking causes lung cancer), or it can correlate with another (such as smoking is correlated with high alcohol consumption). If one action causes another, then they are most certainly correlated. But just because two things occur together does not mean that one caused the other, even if it seems to make sense.
Tyler Vigen has set up an Internet site called Spurious Correlations where you can try out to find correlation between any kind of variables and then think if these graphs represent causality.
Here are some examples and possible headlines for newspapers !
If you eat to much cheese, you’ll die tangled in your bedsheets
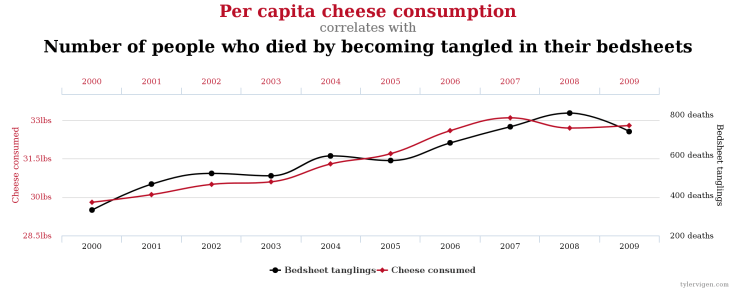
Golf players are responsible for growing cheese consumption

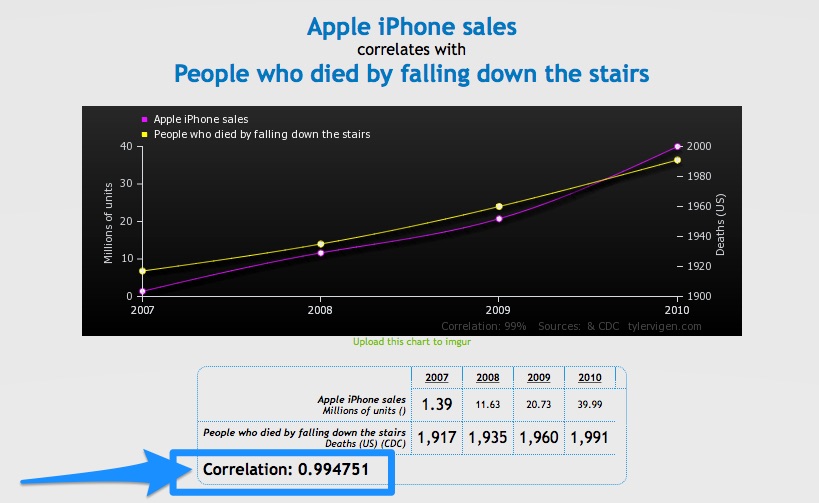
Does Apple’s Iphone kill people by falling down the stairs ?

Do sociologists kill by anticoagulants ??


You must be logged in to post a comment.